Render kinds and options
The trailing RENDER <kind> [WITH (…)] clause decides how a result is
displayed. A query with no RENDER clause renders as a table.
Text kinds
Section titled “Text kinds”| Kind | Name | Displays |
|---|---|---|
list | List | Bulleted text list. |
table | Table | Plain data table. |
leaderboard | Leaderboard | Ranked leaderboard text, optionally @mentioning top rows. |
leaderboard is the only kind that @mentions people, and it takes its own
option: mentions = <n> pings the top n ranked rows, mentions = all pings
every eligible row, and mentions = 0 pings nobody. Omitted, it pings the top
three. Rows grouped by anything other than a player never mention anyone, even
when a champion name happens to match an alias.
Chart kinds
Section titled “Chart kinds”| Kind | Name | Displays |
|---|---|---|
bar_chart | Bar chart | Categorical bar chart. |
line_chart | Line chart | Categorical or temporal line chart. |
stacked_bar | Stacked bar | Stacked multi-output bar chart. |
area_chart | Area chart | Filled categorical or temporal trend. |
donut_chart | Donut chart | Part-to-whole chart for bounded rows. |
scatter_chart | Scatter chart | Compare two outputs, optionally sized by a third. |
heatmap | Heatmap | Two-dimensional matrix colored by an output. |
radar_chart | Radar chart | Compare three to eight normalized outputs. |
kpi_card | KPI card | One aggregate row displayed as metric cards. |
bump_chart | Bump chart | Rank-position movement over time. |
calendar_heatmap | Calendar heatmap | Daily activity or performance on a calendar grid. |
histogram | Histogram | Distribution over a numeric bucket grouping, such as FLOOR(game_duration_seconds / 300) * 300. |
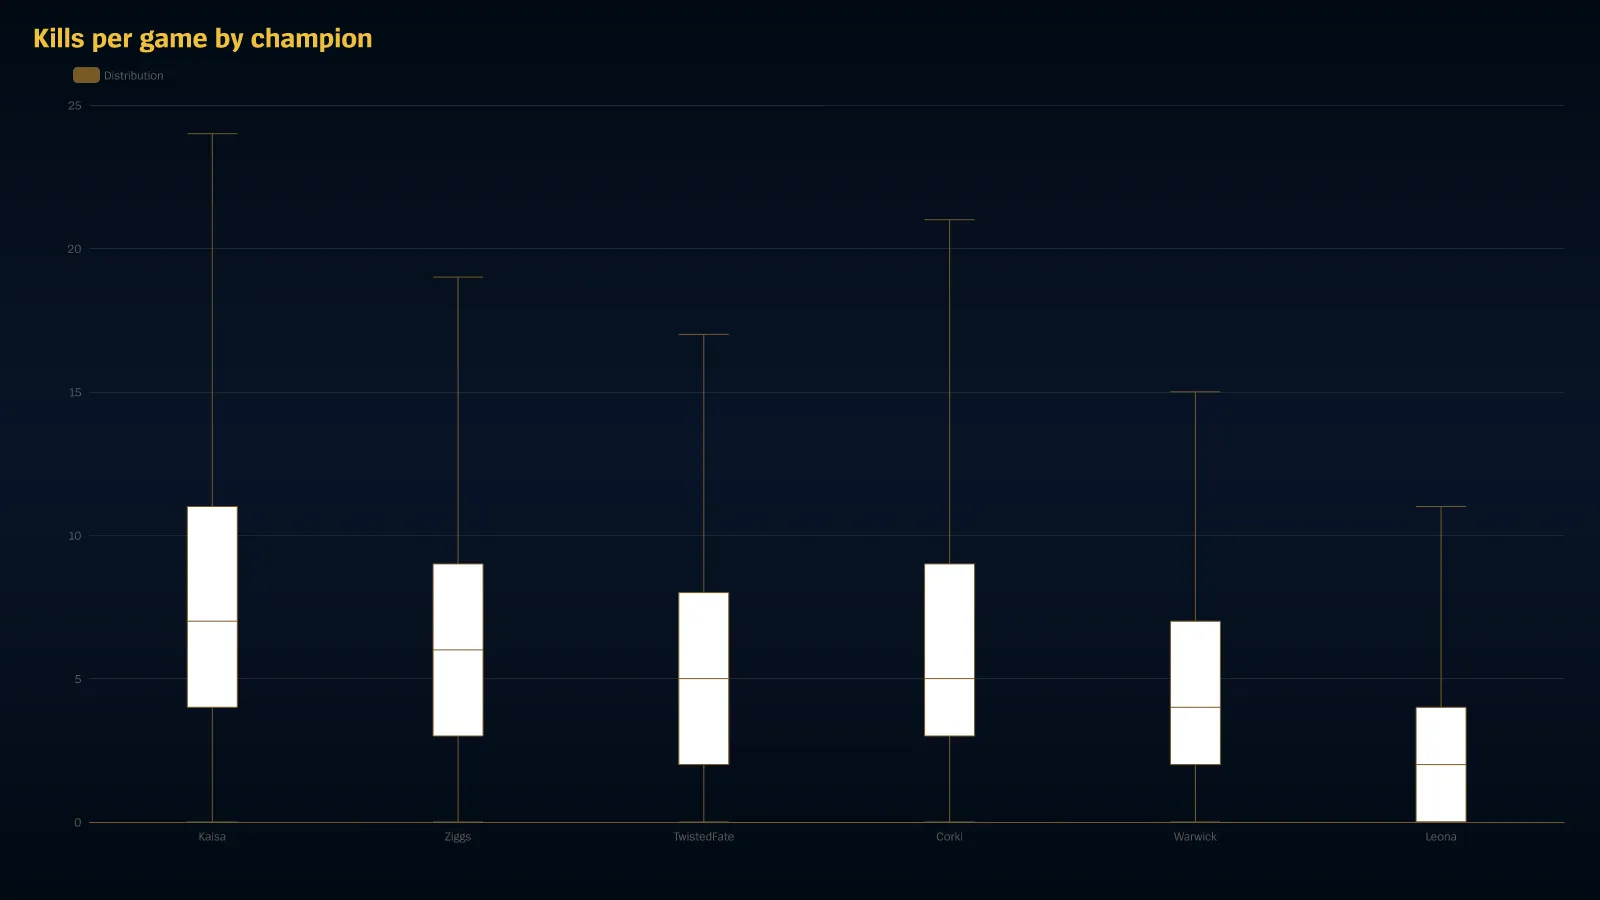
box_plot | Box plot | Five-number summary per group: min, q1, median, q3 and max, named in that order as y. |
Charts are rendered to an image and posted as an attachment, so the destination channel needs the Attach Files permission.
WITH options
Section titled “WITH options”| Option | Syntax | Effect |
|---|---|---|
x | x = <output> | Horizontal channel; defaults to the grouping. |
y | y = <output> | (a, b, …) | The numeric series, up to eight. |
series | series = <grouping> | Which grouping splits into series. |
size | size = <output> | Sizes scatter points. |
value | value = <output> | The cell value of a heatmap. |
title | title = '…' | Overrides the report's title on the image. |
subtitle | subtitle = '…' | A line under the title. |
x_axis | x_axis = '…' | Label for the horizontal axis. |
y_axis | y_axis = '…' | Label for the vertical axis. |
theme | theme = <name> | Chart theme: one of lol_dark, lol_light, minimal_dark, minimal_light. |
palette | palette = <name> | Series colours: one of ranked, categorical, team, gold, colorblind. |
colors | colors = (#rrggbb, …) | One to eight custom colours, contrast-corrected for the theme. |
orientation | orientation = <name> | Bar direction: one of horizontal, vertical. |
labels | labels = <name> | Value labels on marks: one of auto, show, hide, value, percent. |
legend | legend = <name> | Legend placement: one of auto, none, top, right, bottom. |
sort | sort = <name> | Visual row order without changing the query: one of query, asc, desc. |
smooth | smooth = true | Curves line and area segments. |
rolling | rolling = <n> | Plots a rolling average over n buckets (2–52) instead of raw values. |
cumulative | cumulative = true | Accumulates a running total; only valid for additive outputs. |
stack | stack = <name> | Stacking for stacked_bar and area_chart: one of none, normal, percent. |
trend | trend = true | Overlays a linear trend line. |
annotations | annotations = true | Marks notable points on the series. |
sparkline | sparkline = true | Attaches a small chart image to a table render. |
compare | compare = previous_period | Overlays the equally long period immediately before the window. |
format | format = (<output> = <kind>, …) | Overrides an output's inferred display kind: one of count, decimal, percent, duration, ratio, text, timestamp. |
Every name inside WITH (…) must be one of the query’s own outputs or
groupings. A name the SELECT does not produce is rejected when the query
compiles rather than silently plotting nothing.
What each kind needs
Section titled “What each kind needs”| Kind | Requires |
|---|---|
bar_chart, stacked_bar |
y; optionally orientation |
line_chart, area_chart |
y; a DATE_TRUNC grouping for a time axis |
donut_chart |
exactly one y, and few rows |
scatter_chart |
one x and one y, both SELECTed; optionally size |
heatmap |
value, series, and exactly two groupings |
radar_chart |
three to eight y outputs over one grouping |
kpi_card |
no GROUP BY — one grand-total row |
bump_chart |
one y, a DATE_TRUNC grouping, plus one more grouping to rank |
calendar_heatmap |
one y and DATE_TRUNC('day', …) as the only grouping |
histogram |
one numeric bucket grouping and one count y |
box_plot |
exactly five y outputs — see below |
leaderboard |
optionally mentions |
Comparing against the previous period
Section titled “Comparing against the previous period”compare = previous_period re-runs the same aggregation over the equally long
span immediately before the query’s window and overlays it, giving every point
a baseline, an absolute delta, and a percentage delta.
It needs two things, and says so if either is missing: a stated time window to
take the preceding period of, and a DATE_TRUNC (or patch) grouping to
line the two runs up bucket by bucket.
SELECT DATE_TRUNC('week', game_creation_at) AS week, COUNT(*) FILTER (WHERE win) AS wins, COUNT(*) FILTER (WHERE NOT win) AS lossesFROM match_participantsWHERE game_creation_at >= CURRENT_TIMESTAMP - INTERVAL 90 DAYGROUP BY DATE_TRUNC('week', game_creation_at)ORDER BY week ASCRENDER stacked_bar WITH (y = (wins, losses), compare = previous_period)previous_period is the only comparison in the language.
The box-plot contract
Section titled “The box-plot contract”A box plot takes its five numbers explicitly, and their order in y is the
encoding: minimum, first quartile, median, third quartile, maximum.
SELECT MIN(kills) AS low, QUANTILE_CONT(kills, 0.25) AS q1, MEDIAN(kills) AS med, QUANTILE_CONT(kills, 0.75) AS q3, MAX(kills) AS highFROM match_participantsWHERE game_creation_at >= CURRENT_TIMESTAMP - INTERVAL 30 DAYGROUP BY championORDER BY med DESCLIMIT 6RENDER box_plot WITH (y = (low, q1, med, q3, high))The names are yours; the positions are not. Nothing is inferred from what a
column is called, which is the same bargain the rest of the language makes —
q3 could as easily be a 95th percentile, and only the query knows.
Every kind, rendered
Section titled “Every kind, rendered”Each sample below is produced by compiling the query shown and running it
through Scout’s actual report renderer — the same function that builds what the
bot posts. They are regenerated by bun run generate, so they cannot drift
from the renderer.
table
SELECT COUNT(*) AS games, AVG(win::INT) AS win_rate, kda() AS kdaFROM match_participantsWHERE game_creation_at >= CURRENT_TIMESTAMP - INTERVAL 30 DAYGROUP BY playerORDER BY games DESCLIMIT 6RENDER table**Most games played**```Player | Games | Win Rate | Kda--- | --- | --- | ---Faker | 146 | 57.5% | 4.12Caps | 111 | 51.4% | 3.48Chovy | 90 | 54.4% | 3.91Ruler | 89 | 51.7% | 3.36Keria | 76 | 46.1% | 2.87Zeus | 71 | 53.5% | 3.02```list
SELECT COUNT(*) AS games, AVG(win::INT) AS win_rateFROM match_participantsWHERE game_creation_at >= CURRENT_TIMESTAMP - INTERVAL 30 DAYGROUP BY playerORDER BY games DESCLIMIT 6RENDER list**Most games played**- Faker: Games: 146, Win Rate: 57.5%- Caps: Games: 111, Win Rate: 51.4%- Chovy: Games: 90, Win Rate: 54.4%- Ruler: Games: 89, Win Rate: 51.7%- Keria: Games: 76, Win Rate: 46.1%- Zeus: Games: 71, Win Rate: 53.5%leaderboard
SELECT COUNT(*) AS games, AVG(win::INT) AS win_rateFROM match_participantsWHERE game_creation_at >= CURRENT_TIMESTAMP - INTERVAL 30 DAYGROUP BY playerORDER BY games DESCLIMIT 6RENDER leaderboard WITH (mentions = 0)**Most games played**1. Faker — Games: 146, Win Rate: 57.5%2. Caps — Games: 111, Win Rate: 51.4%3. Chovy — Games: 90, Win Rate: 54.4%4. Ruler — Games: 89, Win Rate: 51.7%5. Keria — Games: 76, Win Rate: 46.1%6. Zeus — Games: 71, Win Rate: 53.5%bar_chart
SELECT COUNT(*) AS gamesFROM match_participantsWHERE game_creation_at >= CURRENT_TIMESTAMP - INTERVAL 30 DAYGROUP BY playerORDER BY games DESCLIMIT 6RENDER bar_chart WITH (y = games)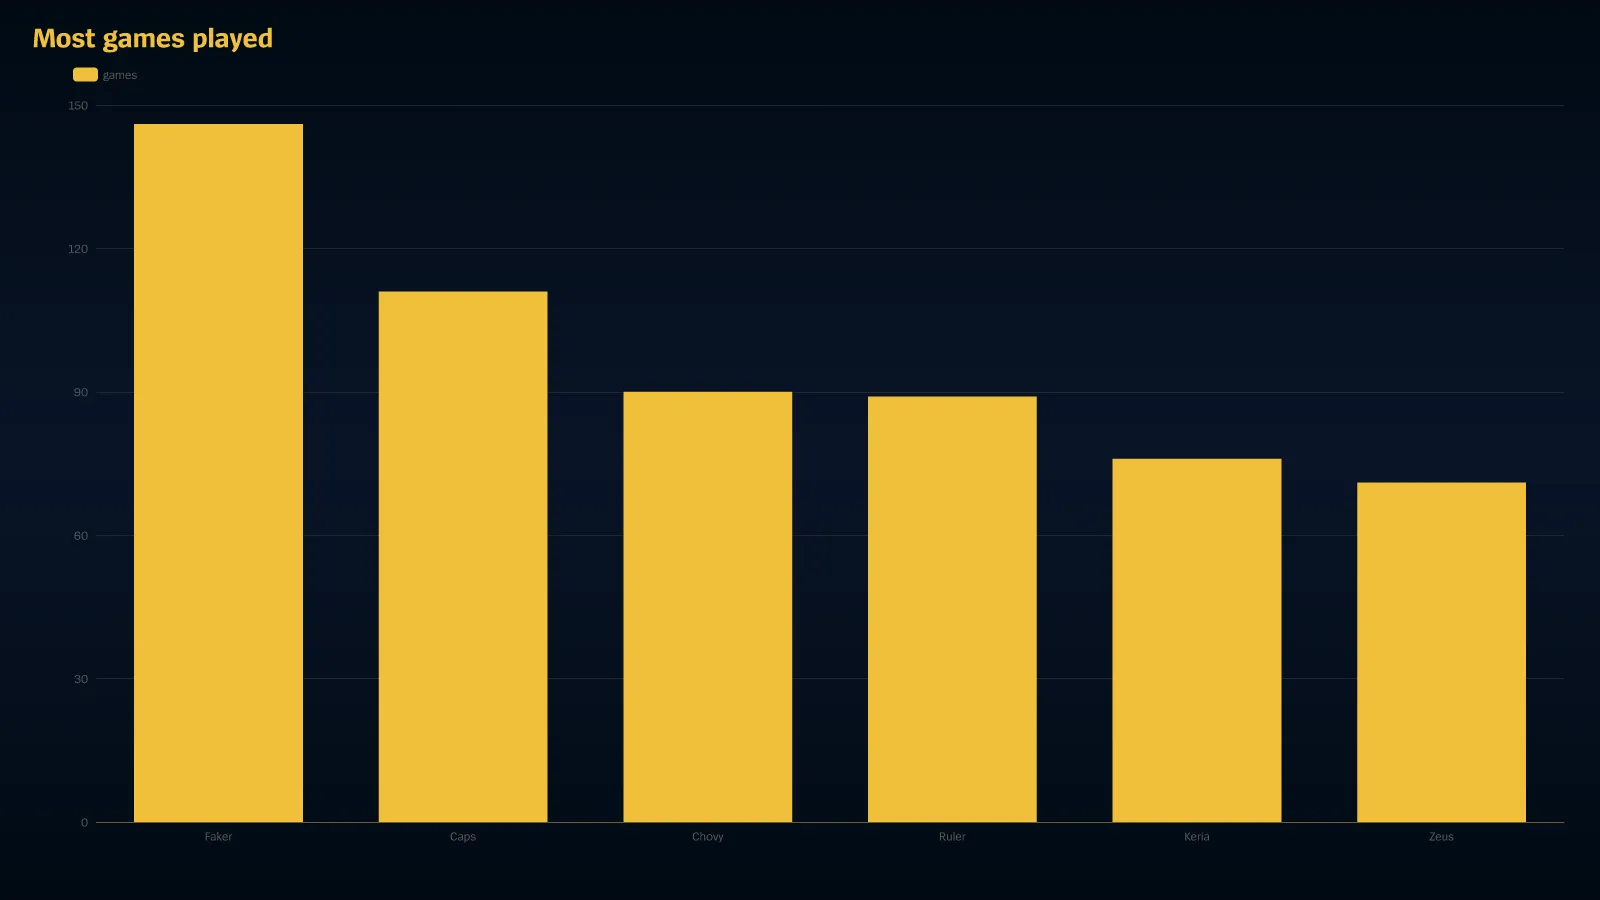
line_chart
SELECT DATE_TRUNC('week', game_creation_at) AS week, COUNT(*) AS gamesFROM match_participantsWHERE game_creation_at >= CURRENT_TIMESTAMP - INTERVAL 30 DAYGROUP BY DATE_TRUNC('week', game_creation_at)ORDER BY week ASCRENDER line_chart WITH (y = games, x_axis = 'Week', smooth = true)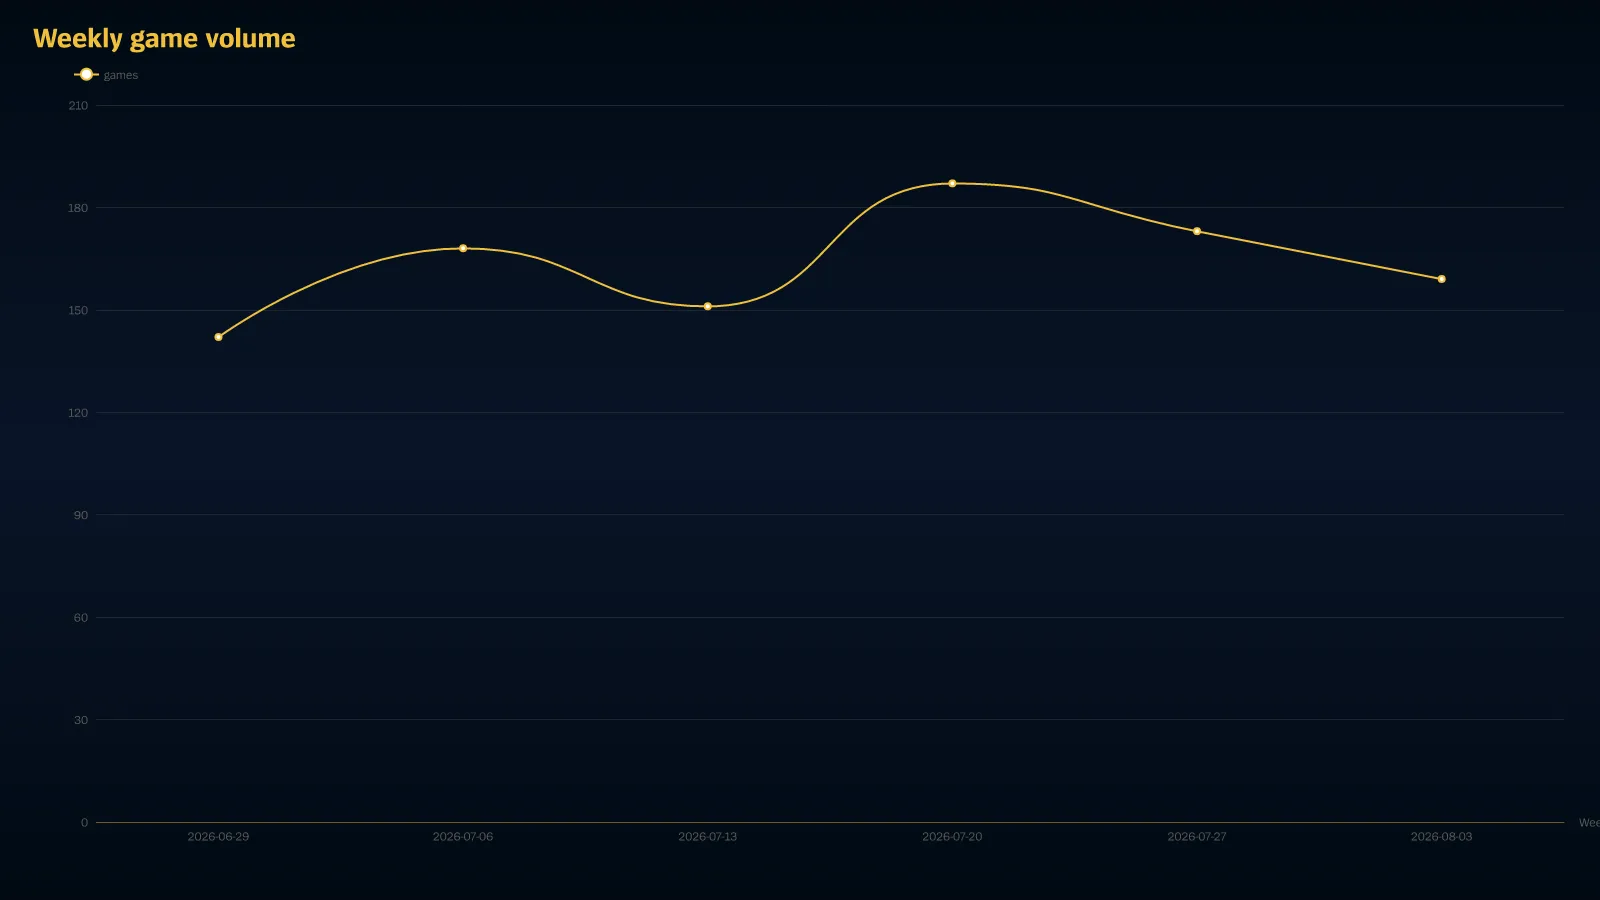
area_chart
SELECT DATE_TRUNC('week', game_creation_at) AS week, COUNT(*) AS gamesFROM match_participantsWHERE game_creation_at >= CURRENT_TIMESTAMP - INTERVAL 30 DAYGROUP BY DATE_TRUNC('week', game_creation_at)ORDER BY week ASCRENDER area_chart WITH (y = games, x_axis = 'Week', smooth = true)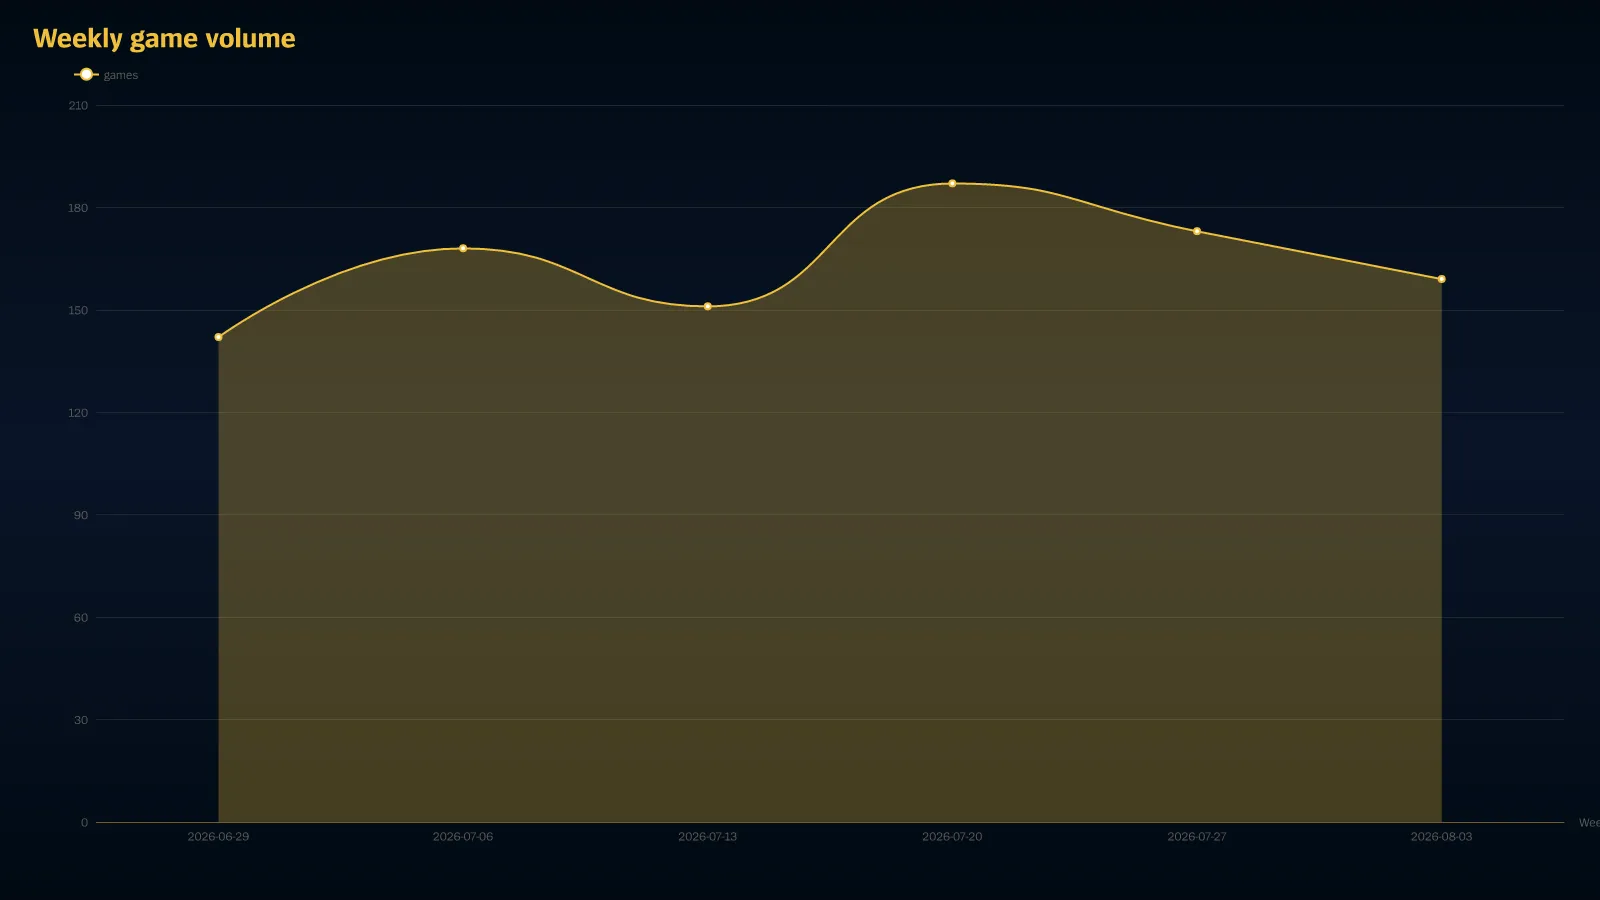
stacked_bar
SELECT DATE_TRUNC('week', game_creation_at) AS week, COUNT(*) FILTER (WHERE win) AS wins, COUNT(*) FILTER (WHERE NOT win) AS lossesFROM match_participantsWHERE game_creation_at >= CURRENT_TIMESTAMP - INTERVAL 30 DAYGROUP BY DATE_TRUNC('week', game_creation_at)ORDER BY week ASCRENDER stacked_bar WITH (y = (wins, losses))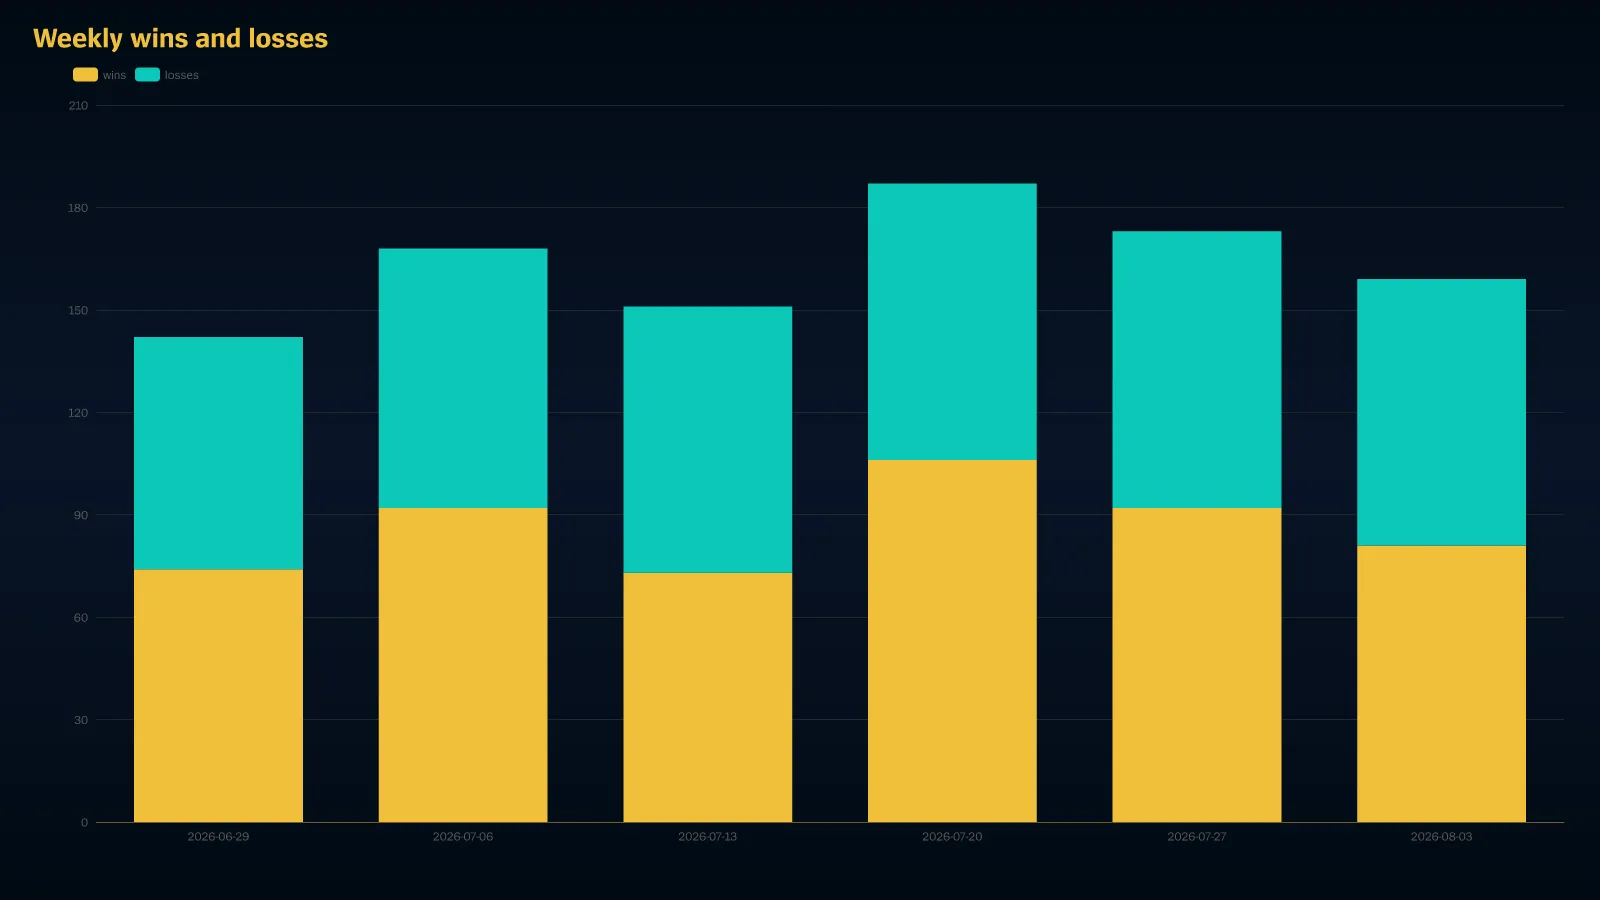
donut_chart
SELECT COUNT(*) AS gamesFROM match_participantsWHERE game_creation_at >= CURRENT_TIMESTAMP - INTERVAL 30 DAYGROUP BY queueORDER BY games DESCRENDER donut_chart WITH (y = games)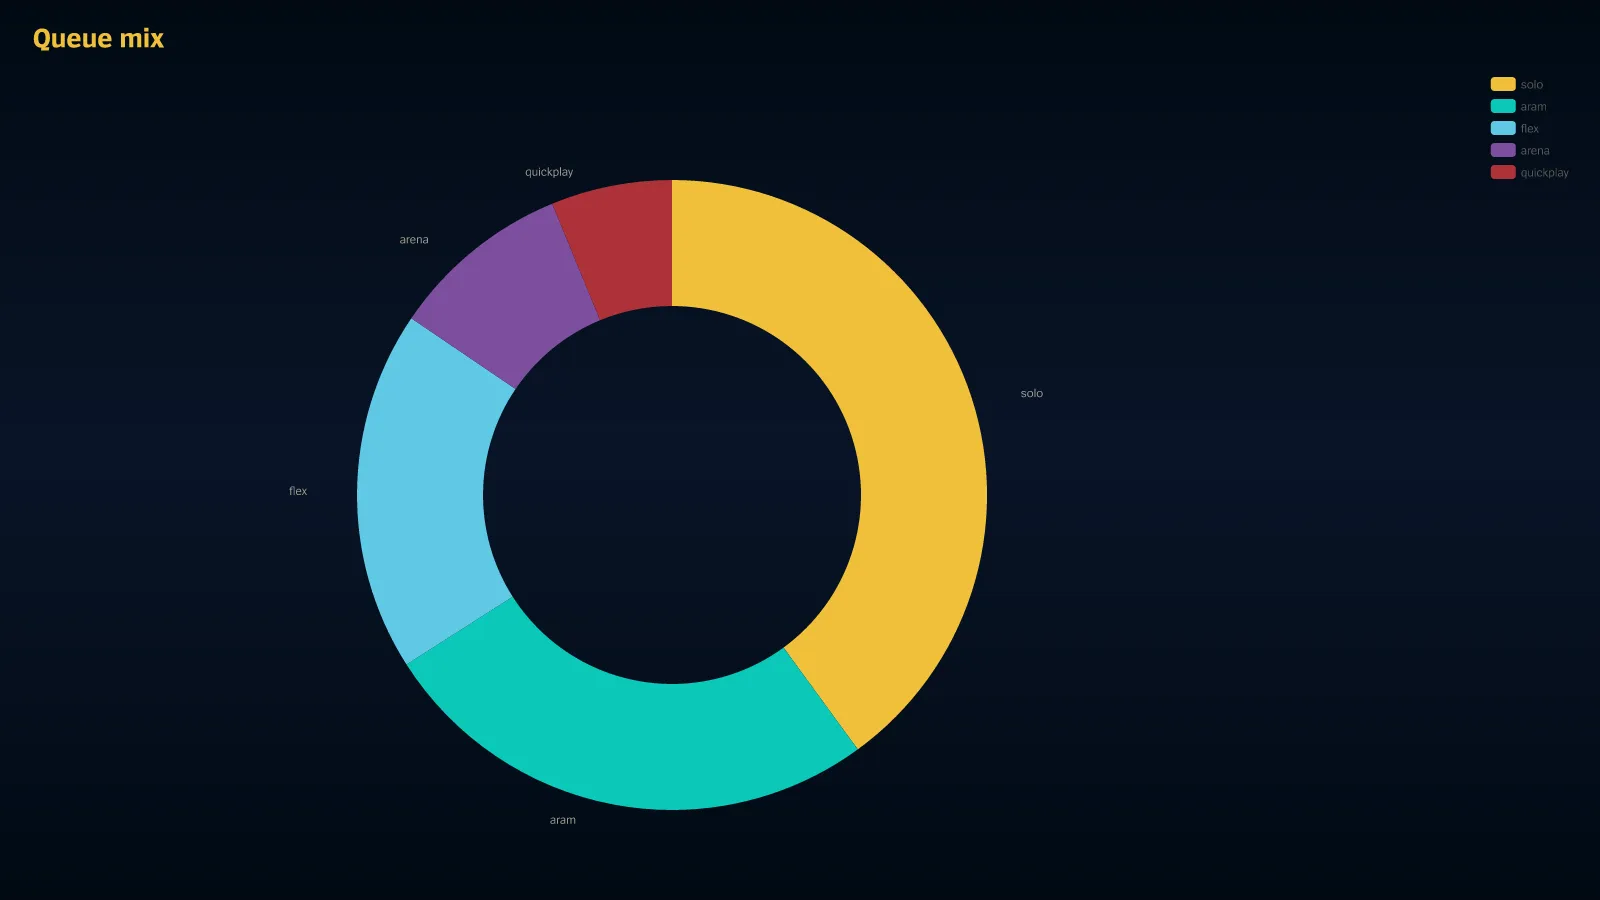
scatter_chart
SELECT SUM(total_damage_dealt_to_champions) AS damage, kda() AS kda, COUNT(*) AS gamesFROM match_participantsWHERE game_creation_at >= CURRENT_TIMESTAMP - INTERVAL 30 DAYGROUP BY playerRENDER scatter_chart WITH (x = damage, y = kda, size = games)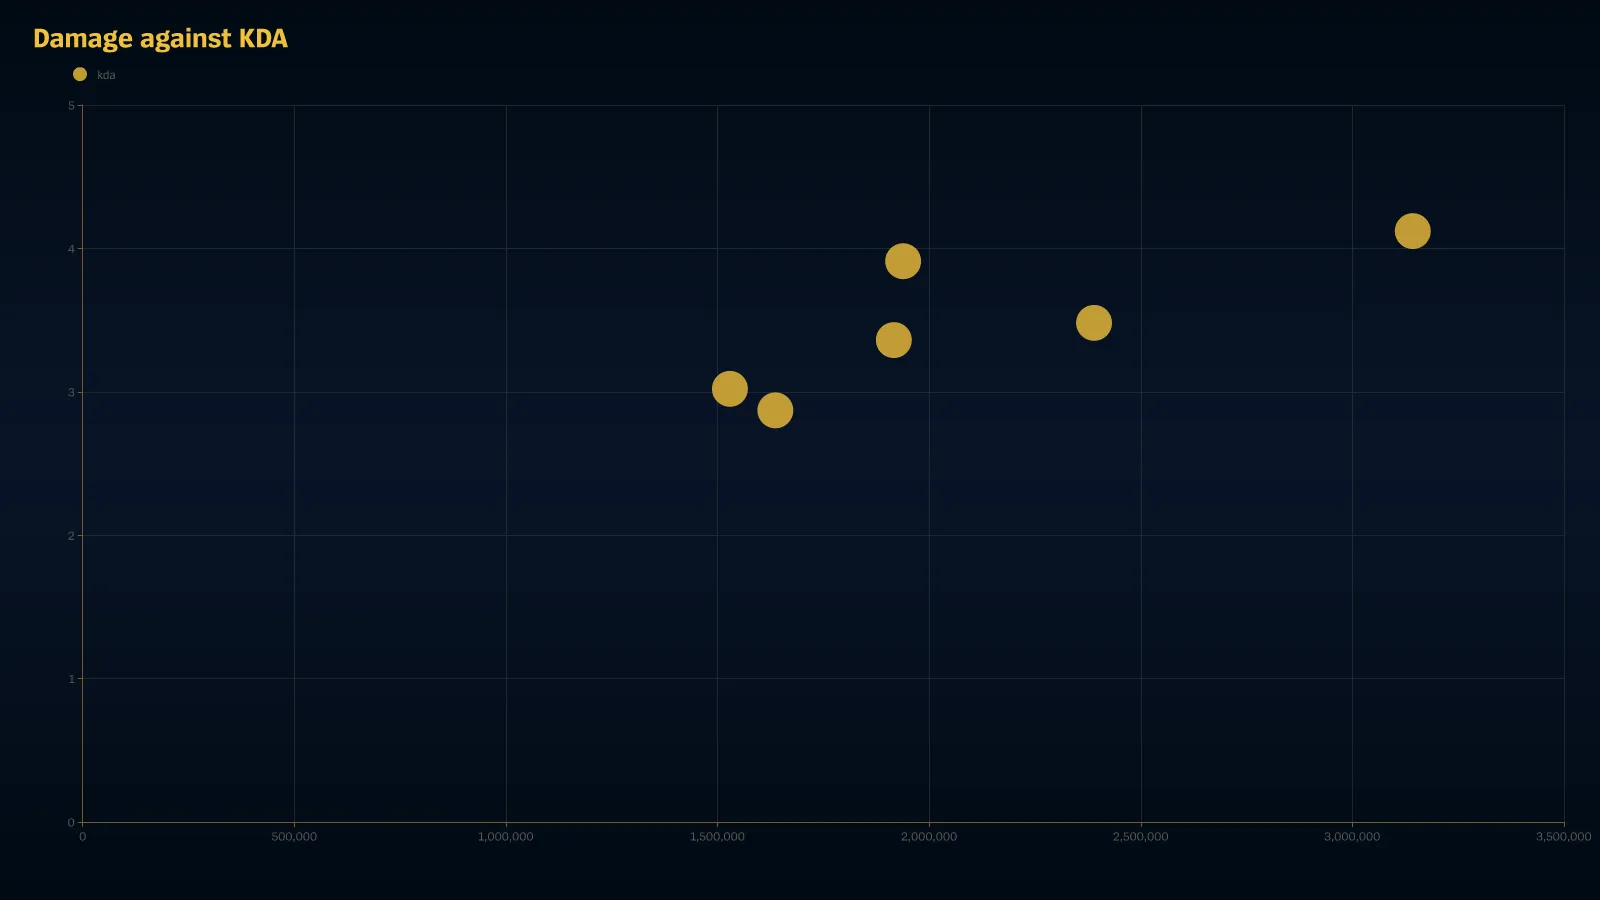
heatmap
SELECT AVG(win::INT) AS win_rateFROM match_participantsWHERE game_creation_at >= CURRENT_TIMESTAMP - INTERVAL 30 DAYGROUP BY champion, team_positionRENDER heatmap WITH (value = win_rate, series = team_position, palette = gold)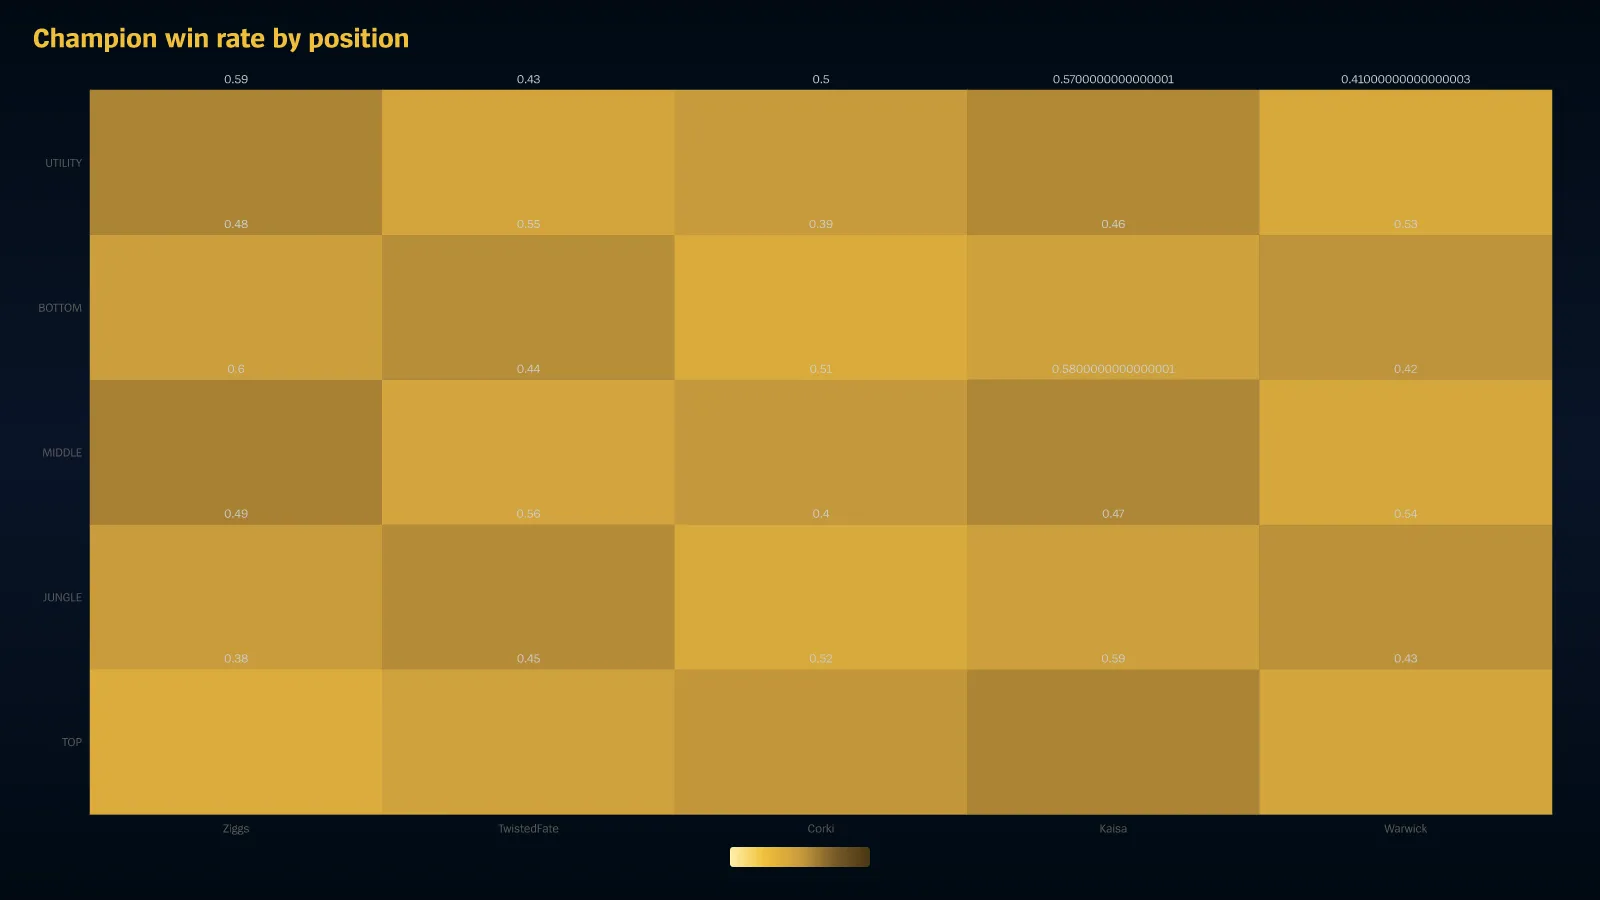
radar_chart
SELECT AVG(win::INT) AS win_rate, kda() AS kda, per_minute(creep_score) AS cs_per_minute, AVG(vision_score) AS vision_score, AVG(total_damage_dealt_to_champions) AS damageFROM match_participantsWHERE game_creation_at >= CURRENT_TIMESTAMP - INTERVAL 30 DAYGROUP BY playerLIMIT 3RENDER radar_chart WITH (y = (win_rate, kda, cs_per_minute, vision_score, damage))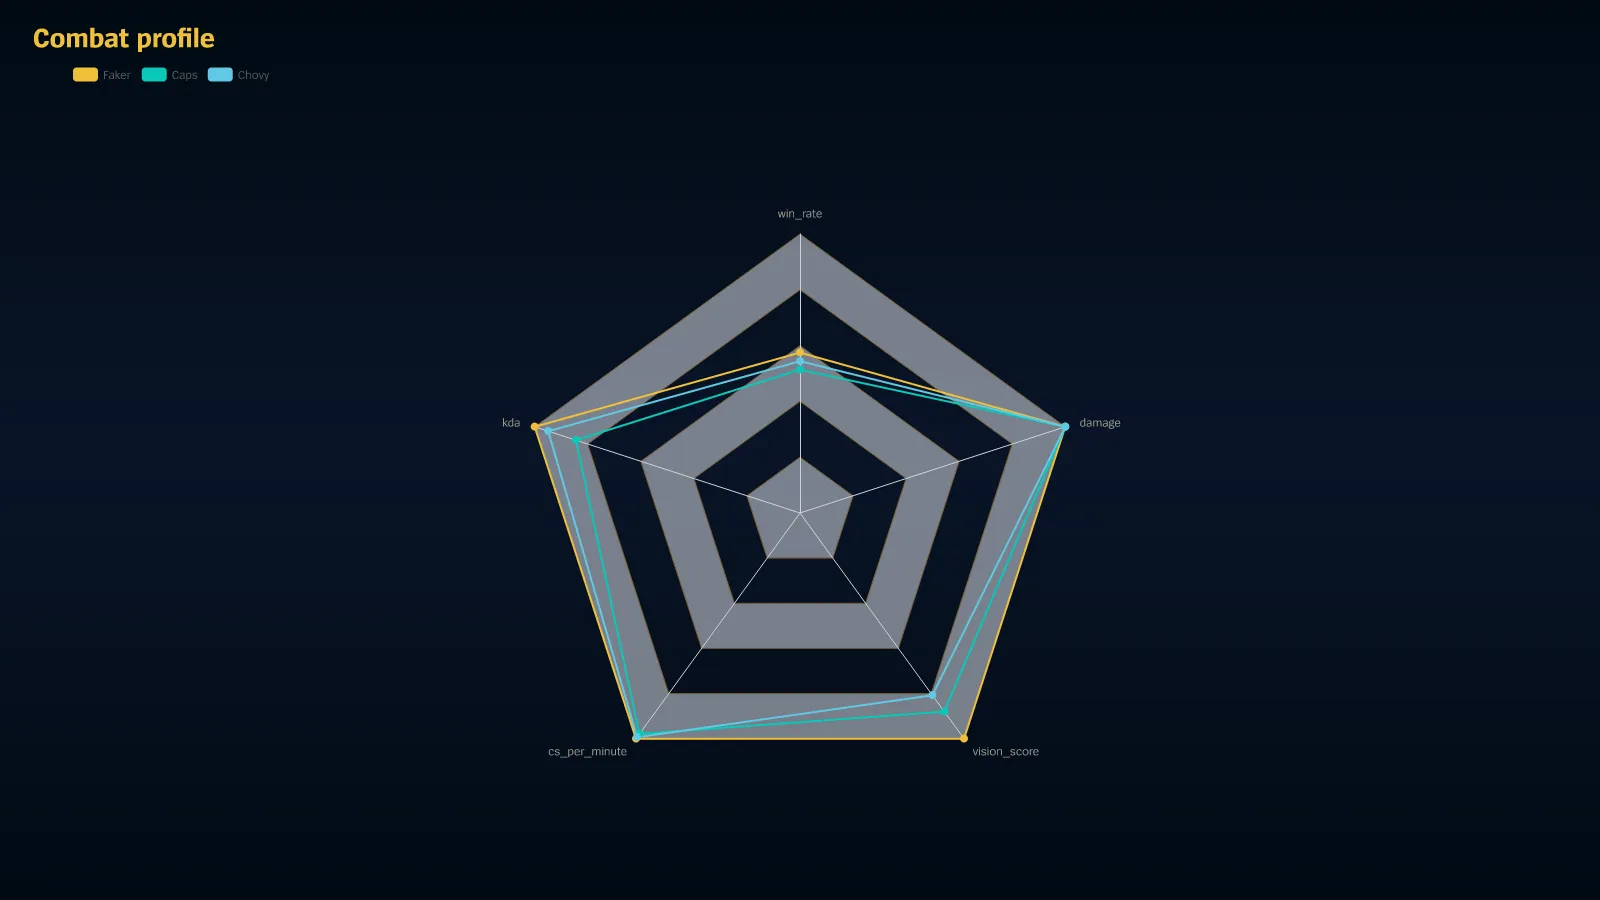
kpi_card
SELECT COUNT(*) AS games, AVG(win::INT) AS win_rate, kda() AS kda, AVG(game_duration_seconds) AS avg_lengthFROM match_participantsWHERE game_creation_at >= CURRENT_TIMESTAMP - INTERVAL 30 DAYRENDER kpi_card WITH (y = (games, win_rate, kda, avg_length))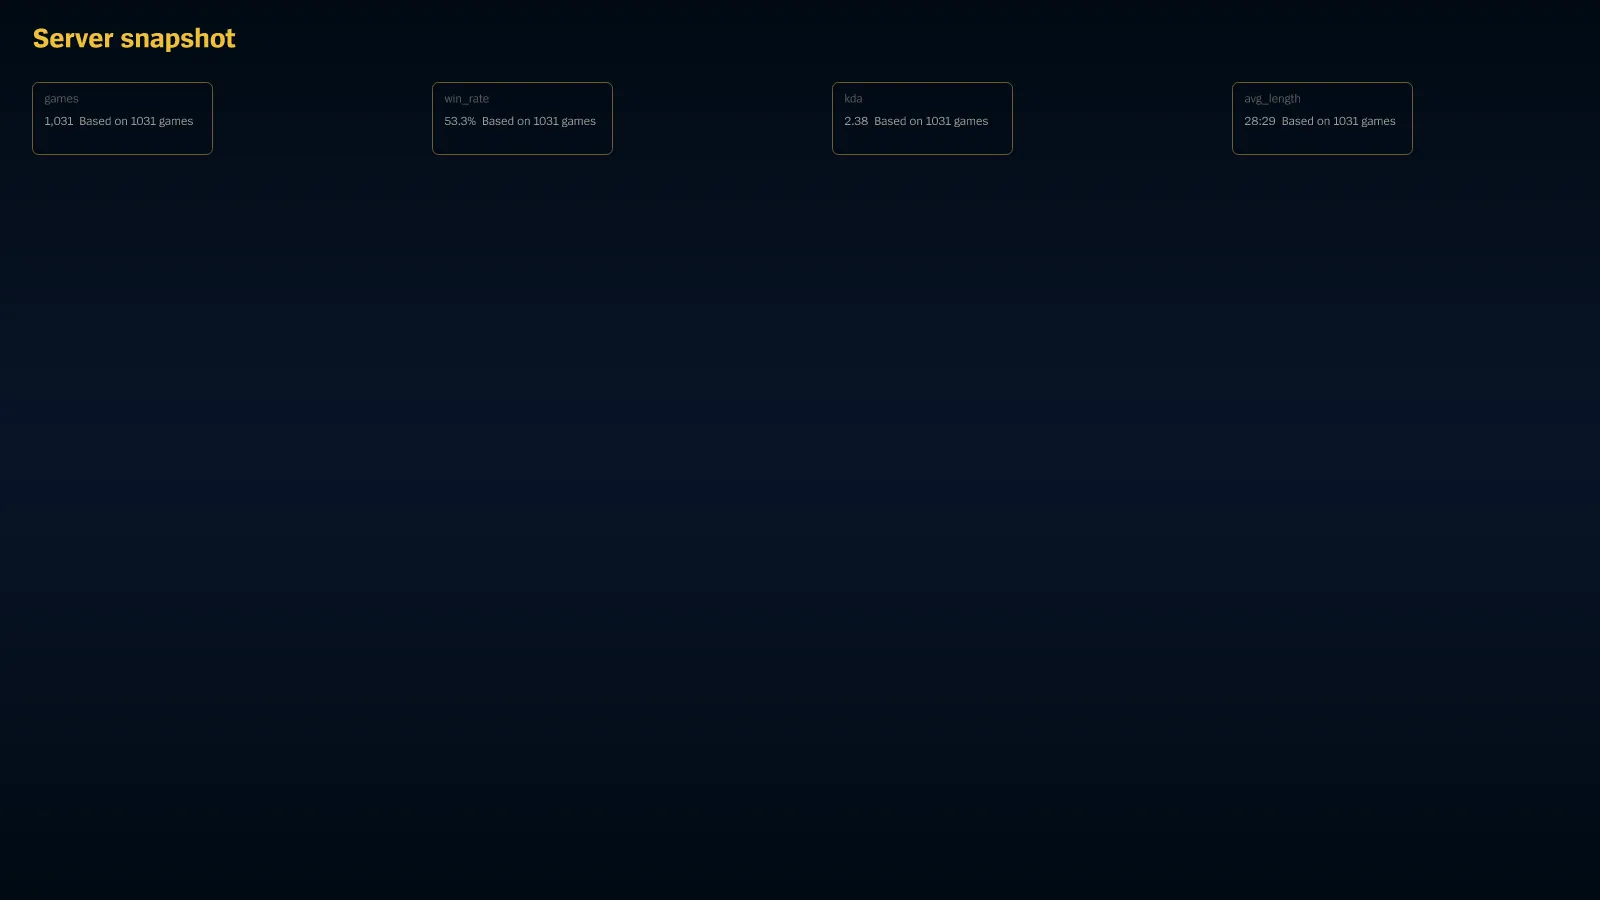
bump_chart
SELECT COUNT(*) AS gamesFROM match_participantsWHERE game_creation_at >= CURRENT_TIMESTAMP - INTERVAL 28 DAYGROUP BY player, DATE_TRUNC('week', game_creation_at)ORDER BY games DESCRENDER bump_chart WITH (y = games)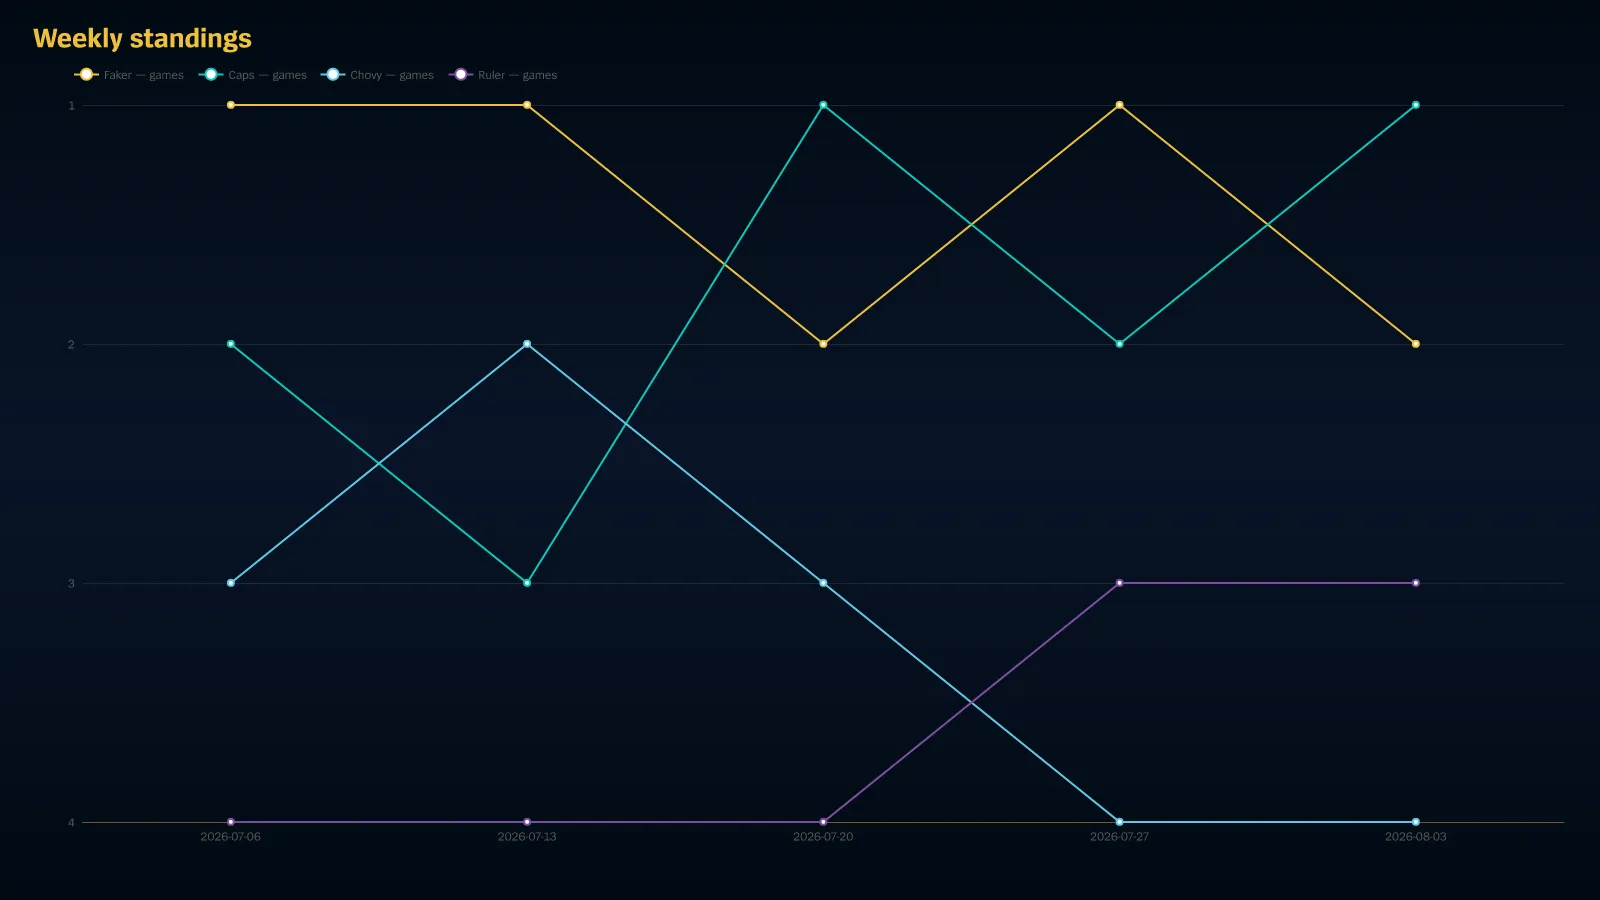
calendar_heatmap
SELECT COUNT(*) AS gamesFROM match_participantsWHERE (game_creation_at AT TIME ZONE 'UTC')::DATE BETWEEN '2026-06-29' AND '2026-07-26'GROUP BY DATE_TRUNC('day', game_creation_at)ORDER BY games DESCRENDER calendar_heatmap WITH (y = games, palette = gold)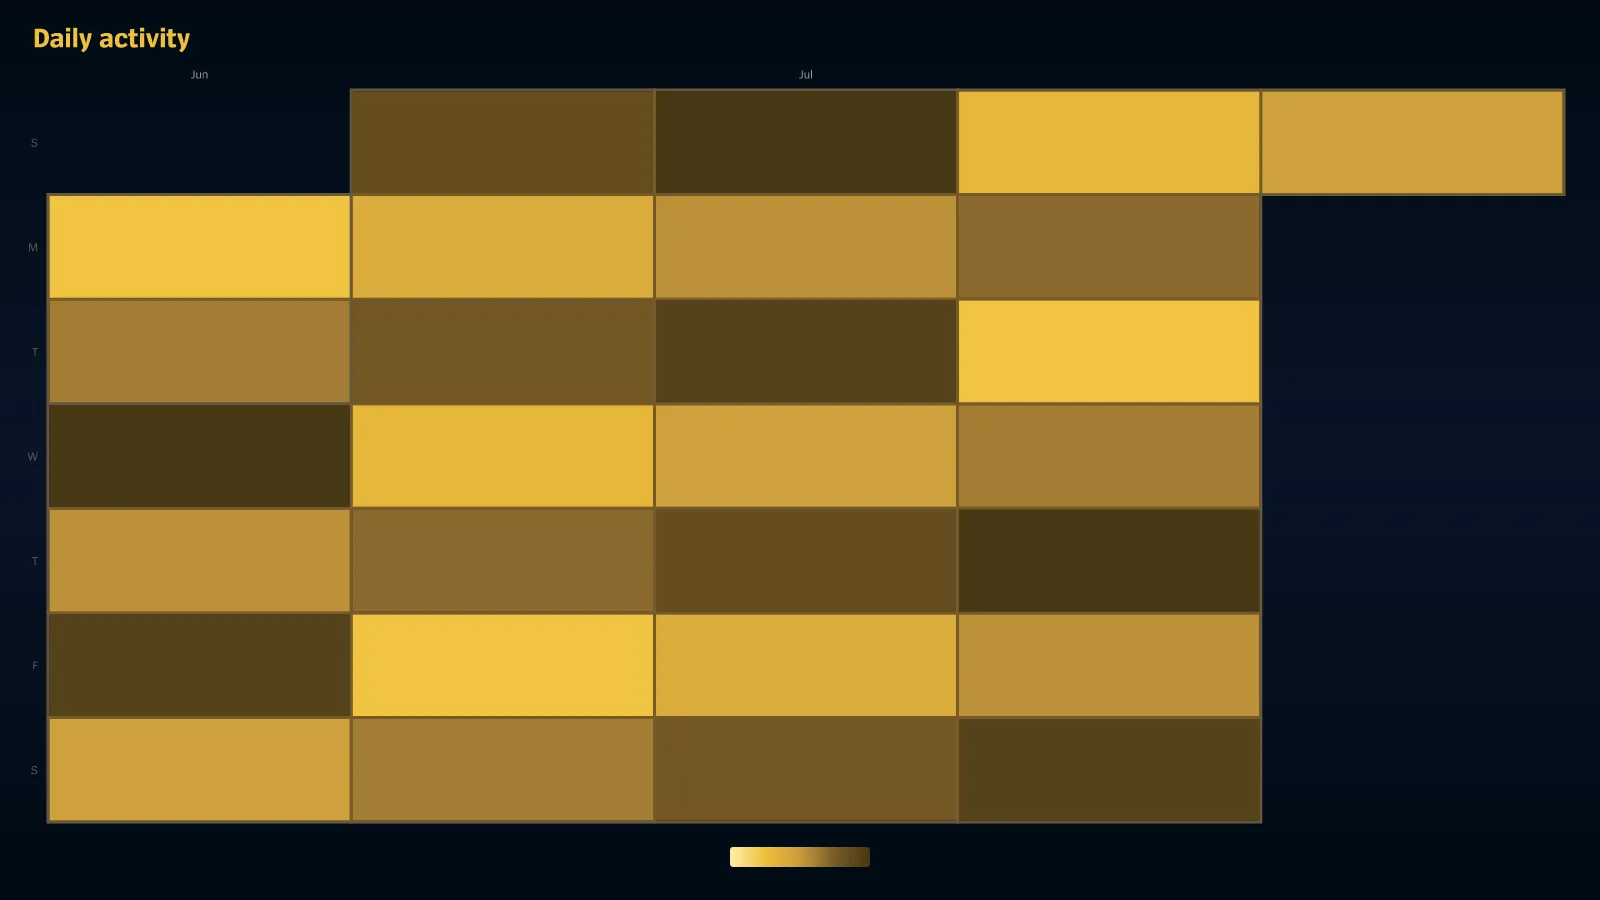
histogram
SELECT FLOOR(game_duration_seconds / 300) * 300 AS bucket, COUNT(*) AS gamesFROM match_participantsWHERE game_creation_at >= CURRENT_TIMESTAMP - INTERVAL 30 DAYGROUP BY FLOOR(game_duration_seconds / 300) * 300ORDER BY bucket ASCRENDER histogram WITH (x = bucket, y = games)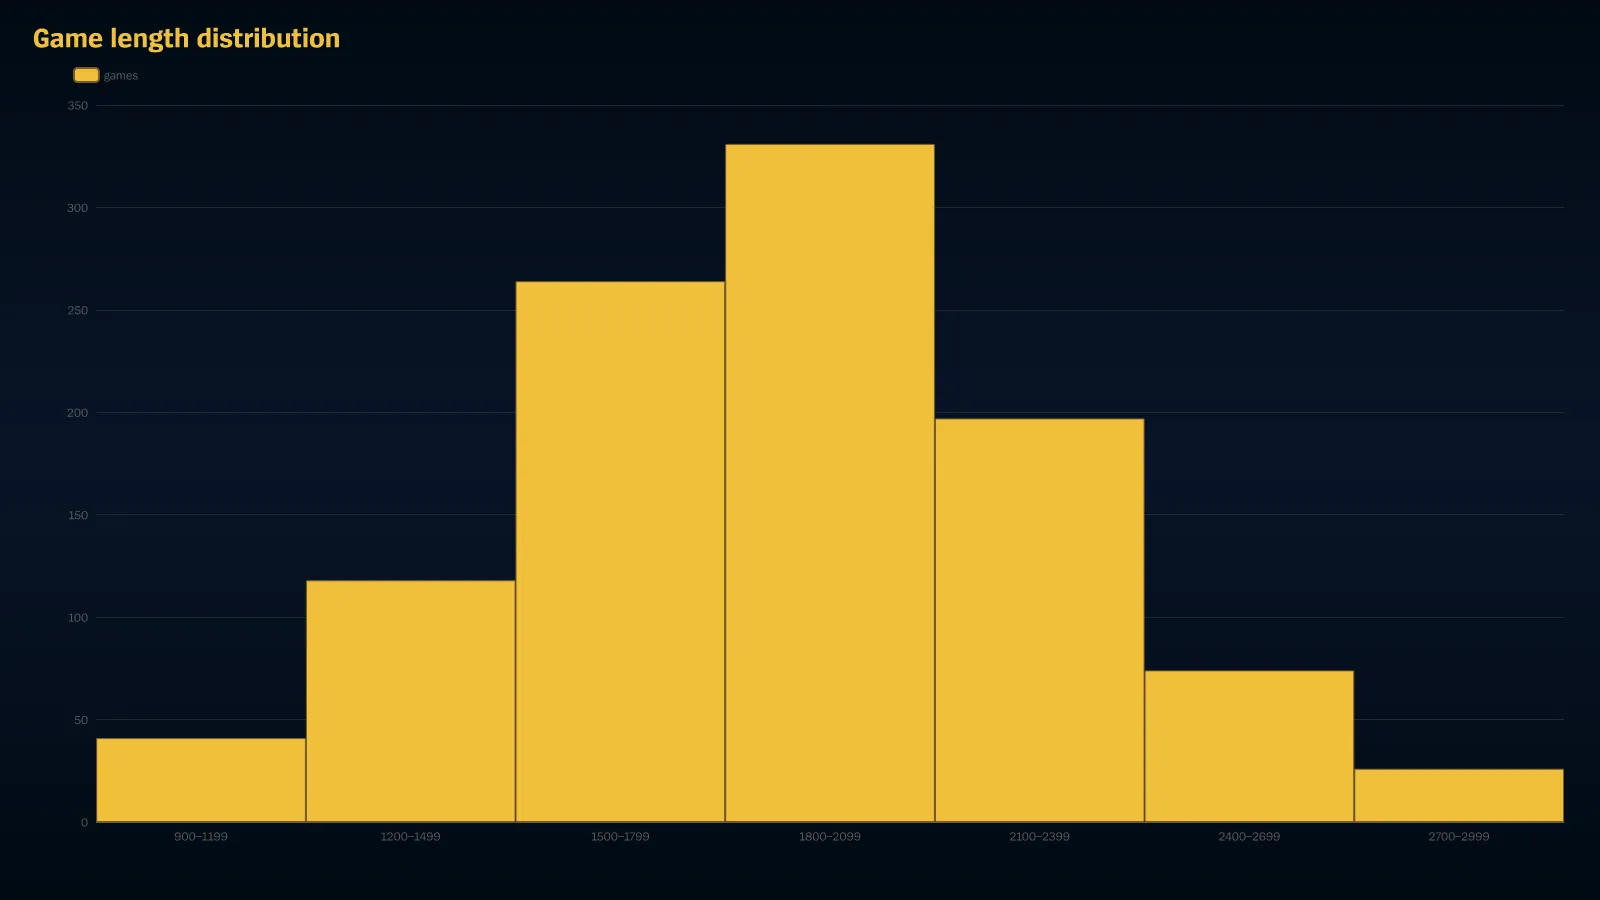
box_plot
SELECT MIN(kills) AS low, QUANTILE_CONT(kills, 0.25) AS q1, MEDIAN(kills) AS med, QUANTILE_CONT(kills, 0.75) AS q3, MAX(kills) AS highFROM match_participantsWHERE game_creation_at >= CURRENT_TIMESTAMP - INTERVAL 30 DAYGROUP BY championORDER BY med DESCLIMIT 6RENDER box_plot WITH (y = (low, q1, med, q3, high))